Basic Layout
When you LJMD application is started, it should look something like this:
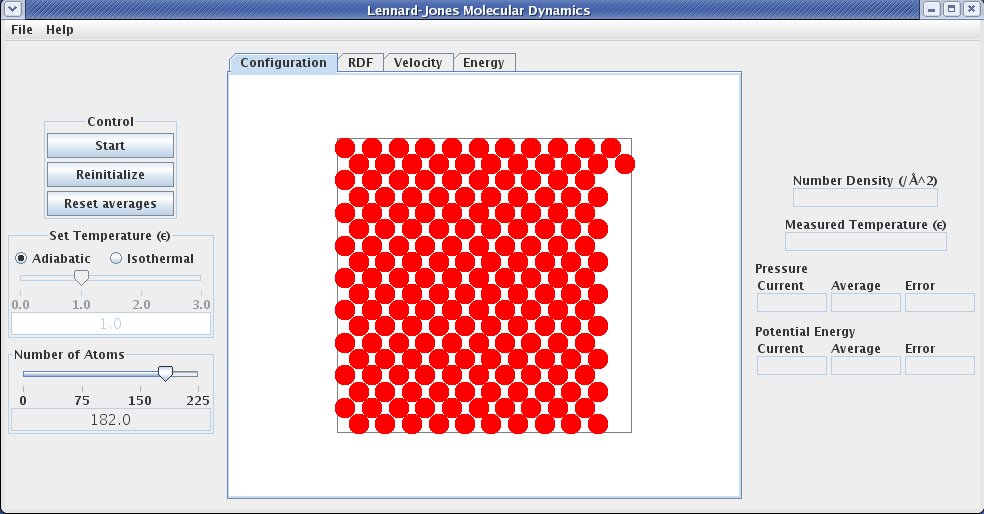
The left side of the display, referred to as the "Control Panel", contains controls that allow the user to interact with the simulation.
The first item on the "Control Panel" is the "Control Box", which contains buttons that :
- Start and stop the simulation (start button)
- Restart the simulation from its initial state (reinitialize button)
- Reset averages by discarding any previous contributions (reset button)
The next item on the "Control Panel" is the temperature control that permits setting the simulation as adiabatic or isothermal with the temperature selection radio buttons. If the temperature selection setting is isothermal, the temperature slider becomes available and allows the simulation temperature to be controlled.
The algorithm for fixing the temperature is simple rescaling of the atom velocities at each time step. The measured temperature is given by the instantaneous kinetic energy, as described in the Background section.
Since the volume of the simulation is fixed, the density of the system can be adjusted by varying the number of atoms with the atoms slider.
The middle section of the display is referred to as the "Grahpics Panel".
The "Graphics Panel" contains four tabs : "Configuration" (configuration tab), "RDF" (rdf tab), "Velocity" (velocity tab), and "Energy" (energy tab). The configuration tab tabbed page displays a graphic of the simulation. The graphic is two dimensional. The rdf tab. The velocity tab. The energy tab displays a plot of the total potential energy and its two components : potential energy and kinetic energy.
On the far right is the "Data Display Panel"
The "Data Display Panel" contains several display elements that report data from the simulation, including the density of the system(density meter), the current temperature (temperature meter), the current and average pressure (pressure meter) and the current and average potential energy (energy meter). The average values are computed using the data taken since the reset button or reinitialize button was pushed, or if neither button has been pushed, since the beginning of the simulation.
All quantities (controlled values and simulation averages) are given in units of the Lennard-Jones size and energy parameters, and , and the atom mass.